Hydrogen Production and Hubs in the United States
|
Through the US Department of Energy’s (DOE) H2Hubs program, the clean hydrogen production tax credit established by the Inflation Reduction Act of 2022, and DOE’s Clean Hydrogen Roadmap, the US is set to more than quintuple its production of hydrogen through low carbon technologies by 2050. The following maps explore several key dimensions of the national hydrogen landscape. In this new map by our hydrogen team at Carbon Solutions, current hydrogen production facilities are shown in relation to the hubs identified in the Great Plains Institute’s Atlas of Carbon and Hydrogen Hubs. As you can see, there’s strong correlation between existing hydrogen production and areas of concentrated industrial activity, emissions, and carbon capture potential. 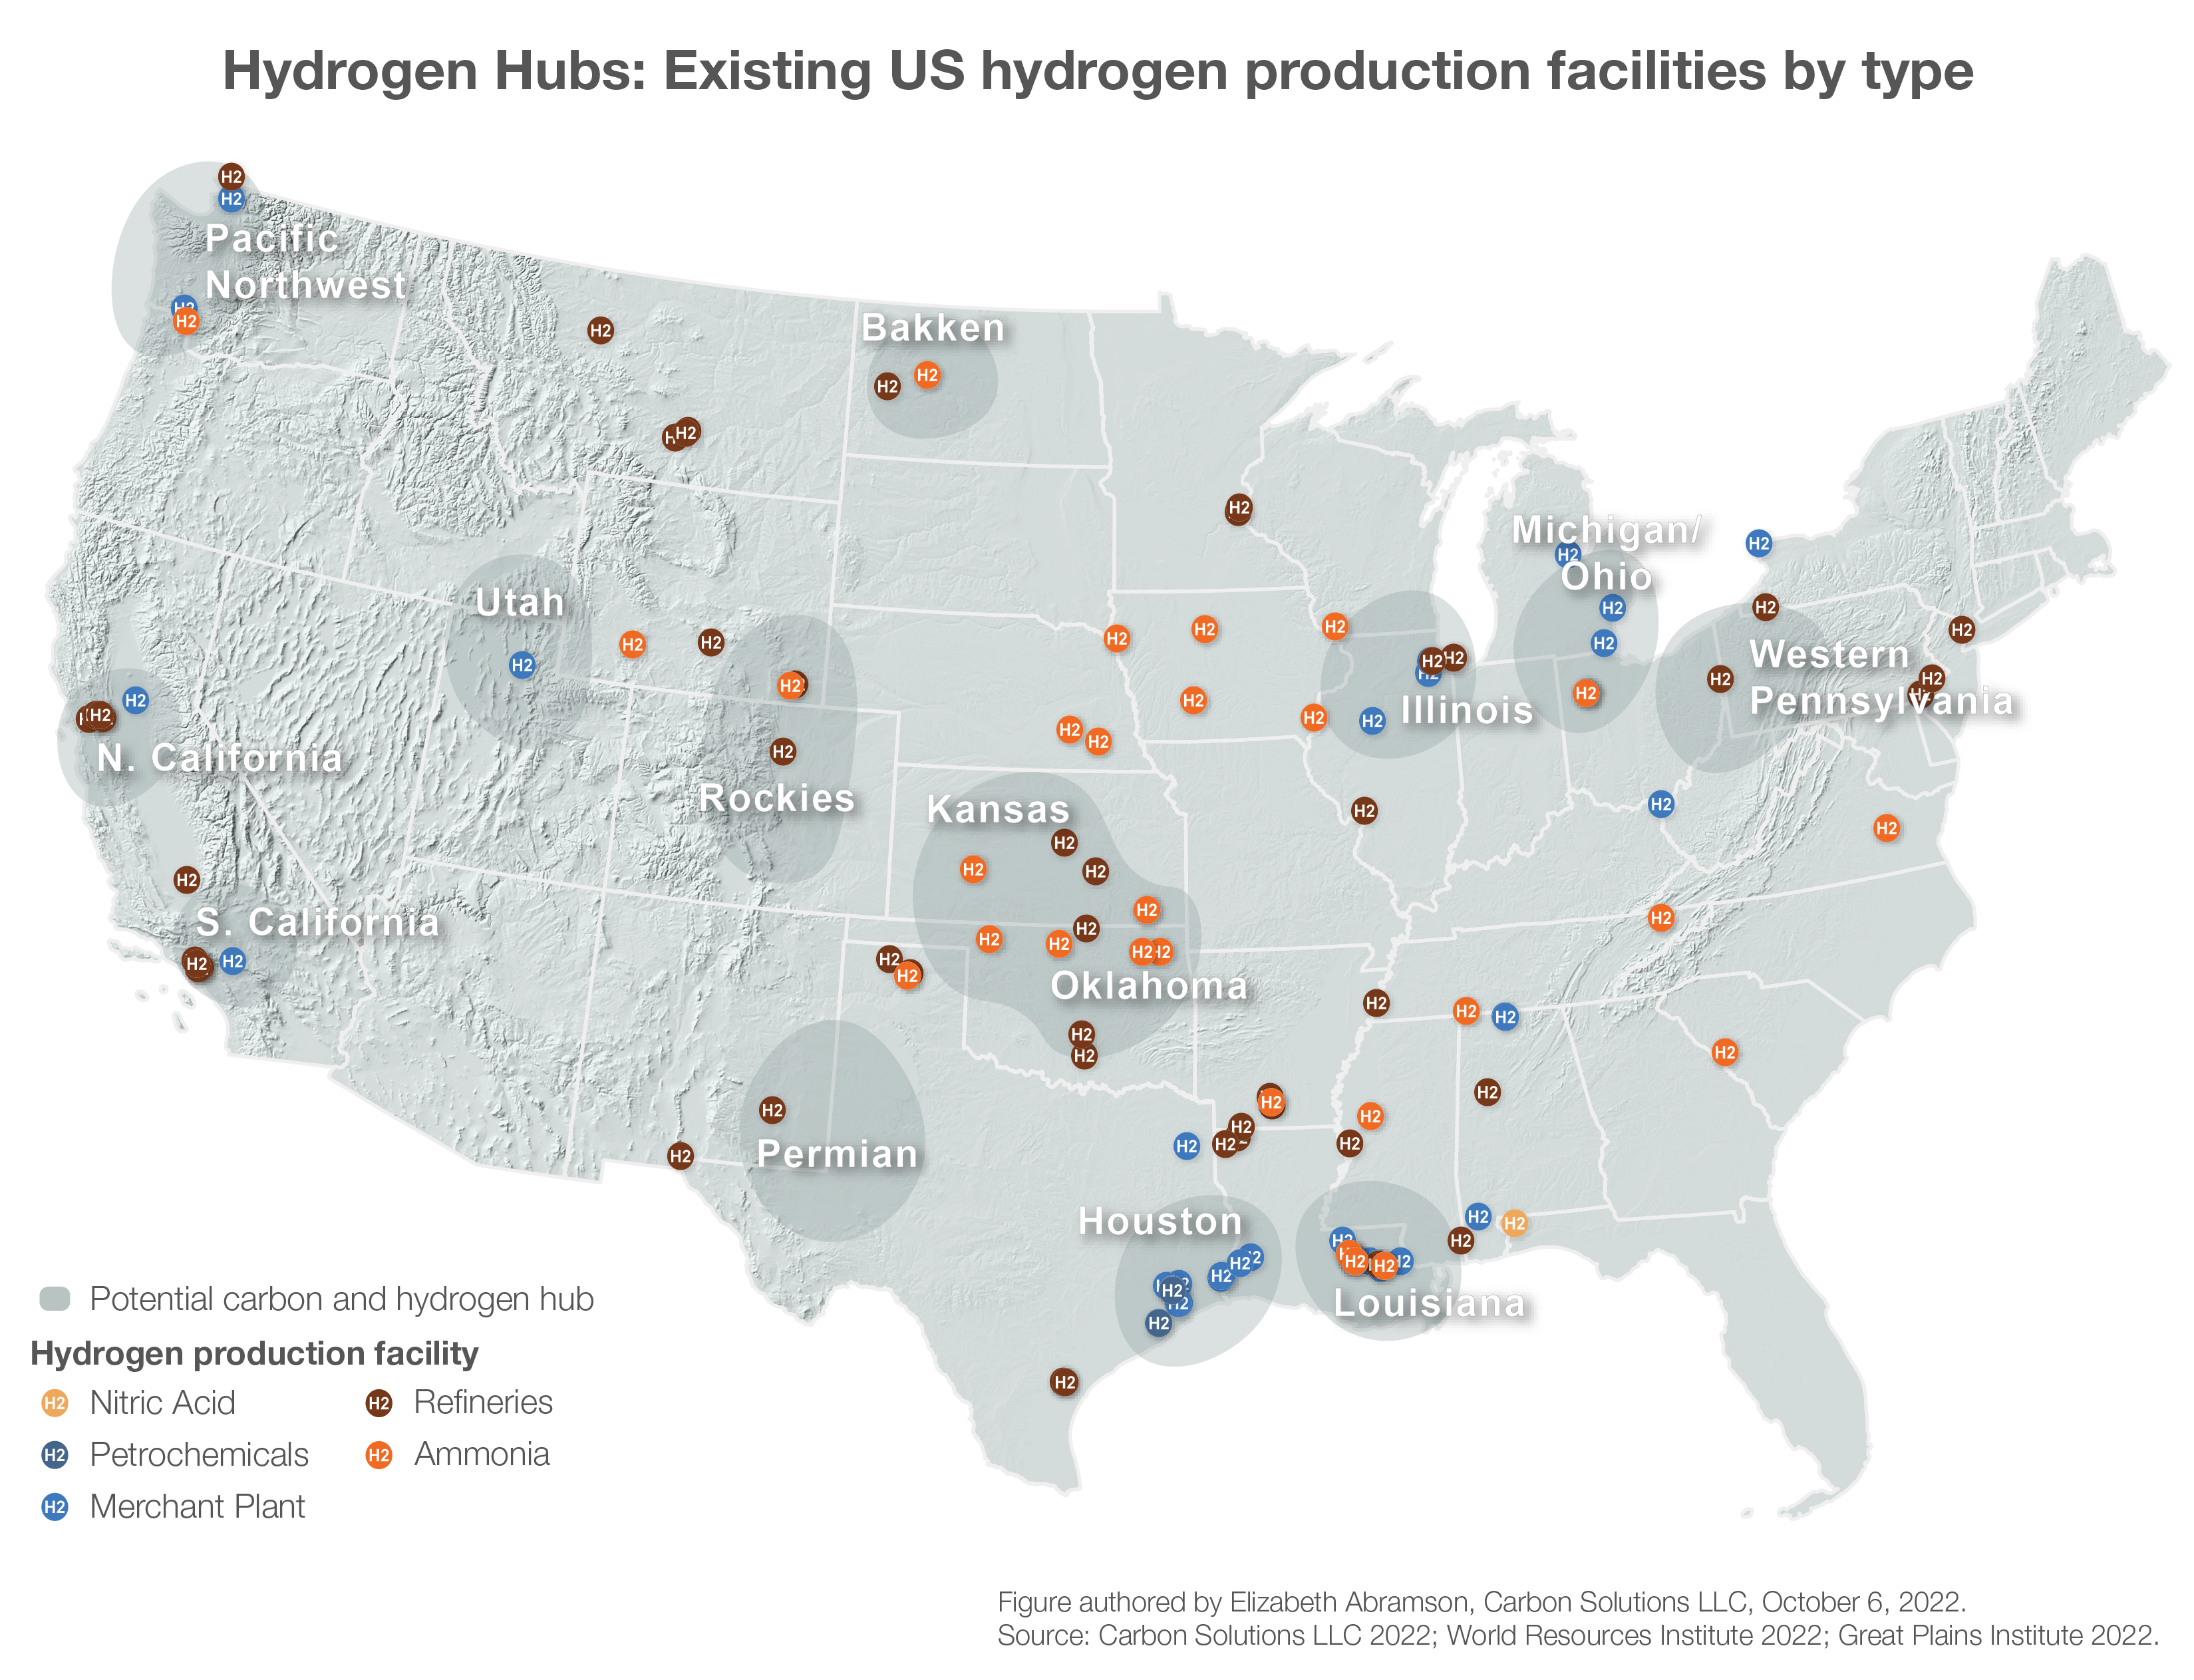
Carbon capture and storageThe DOE’s hydrogen hubs (H2Hubs) program is set to provide $7 billion in funding for six to ten hydrogen hubs throughout the United States, including methane-based production that employs carbon capture and storage. While the DOE’s Hydrogen Roadmap aims to achieve “gigawatt scale” production of electrolysis-based hydrogen by the late 2020s, the majority of hydrogen produced in the US is made through the reformation of methane (natural gas). In order to be considered ‘clean hydrogen’ and qualify for the hydrogen product tax credit, methane-based hydrogen must utilize carbon capture and storage to achieve a low carbon intensity. The establishment of regional hydrogen hubs and widespread production of clean hydrogen through methane reformation will thus require permanent and secure geologic storage of captured CO2. Carbon Solutions analysts are using the SCO2T geologic storage model to assess carbon storage capacity throughout the United States. The map below can help identify key areas of opportunity for permanent and secure geologic storage of large quantities of CO2, allowing the United States to meet its decarbonization and climate goals. These storage formations will enable deep greenhouse gas reductions for both existing hydrogen production and for future hydrogen hubs. 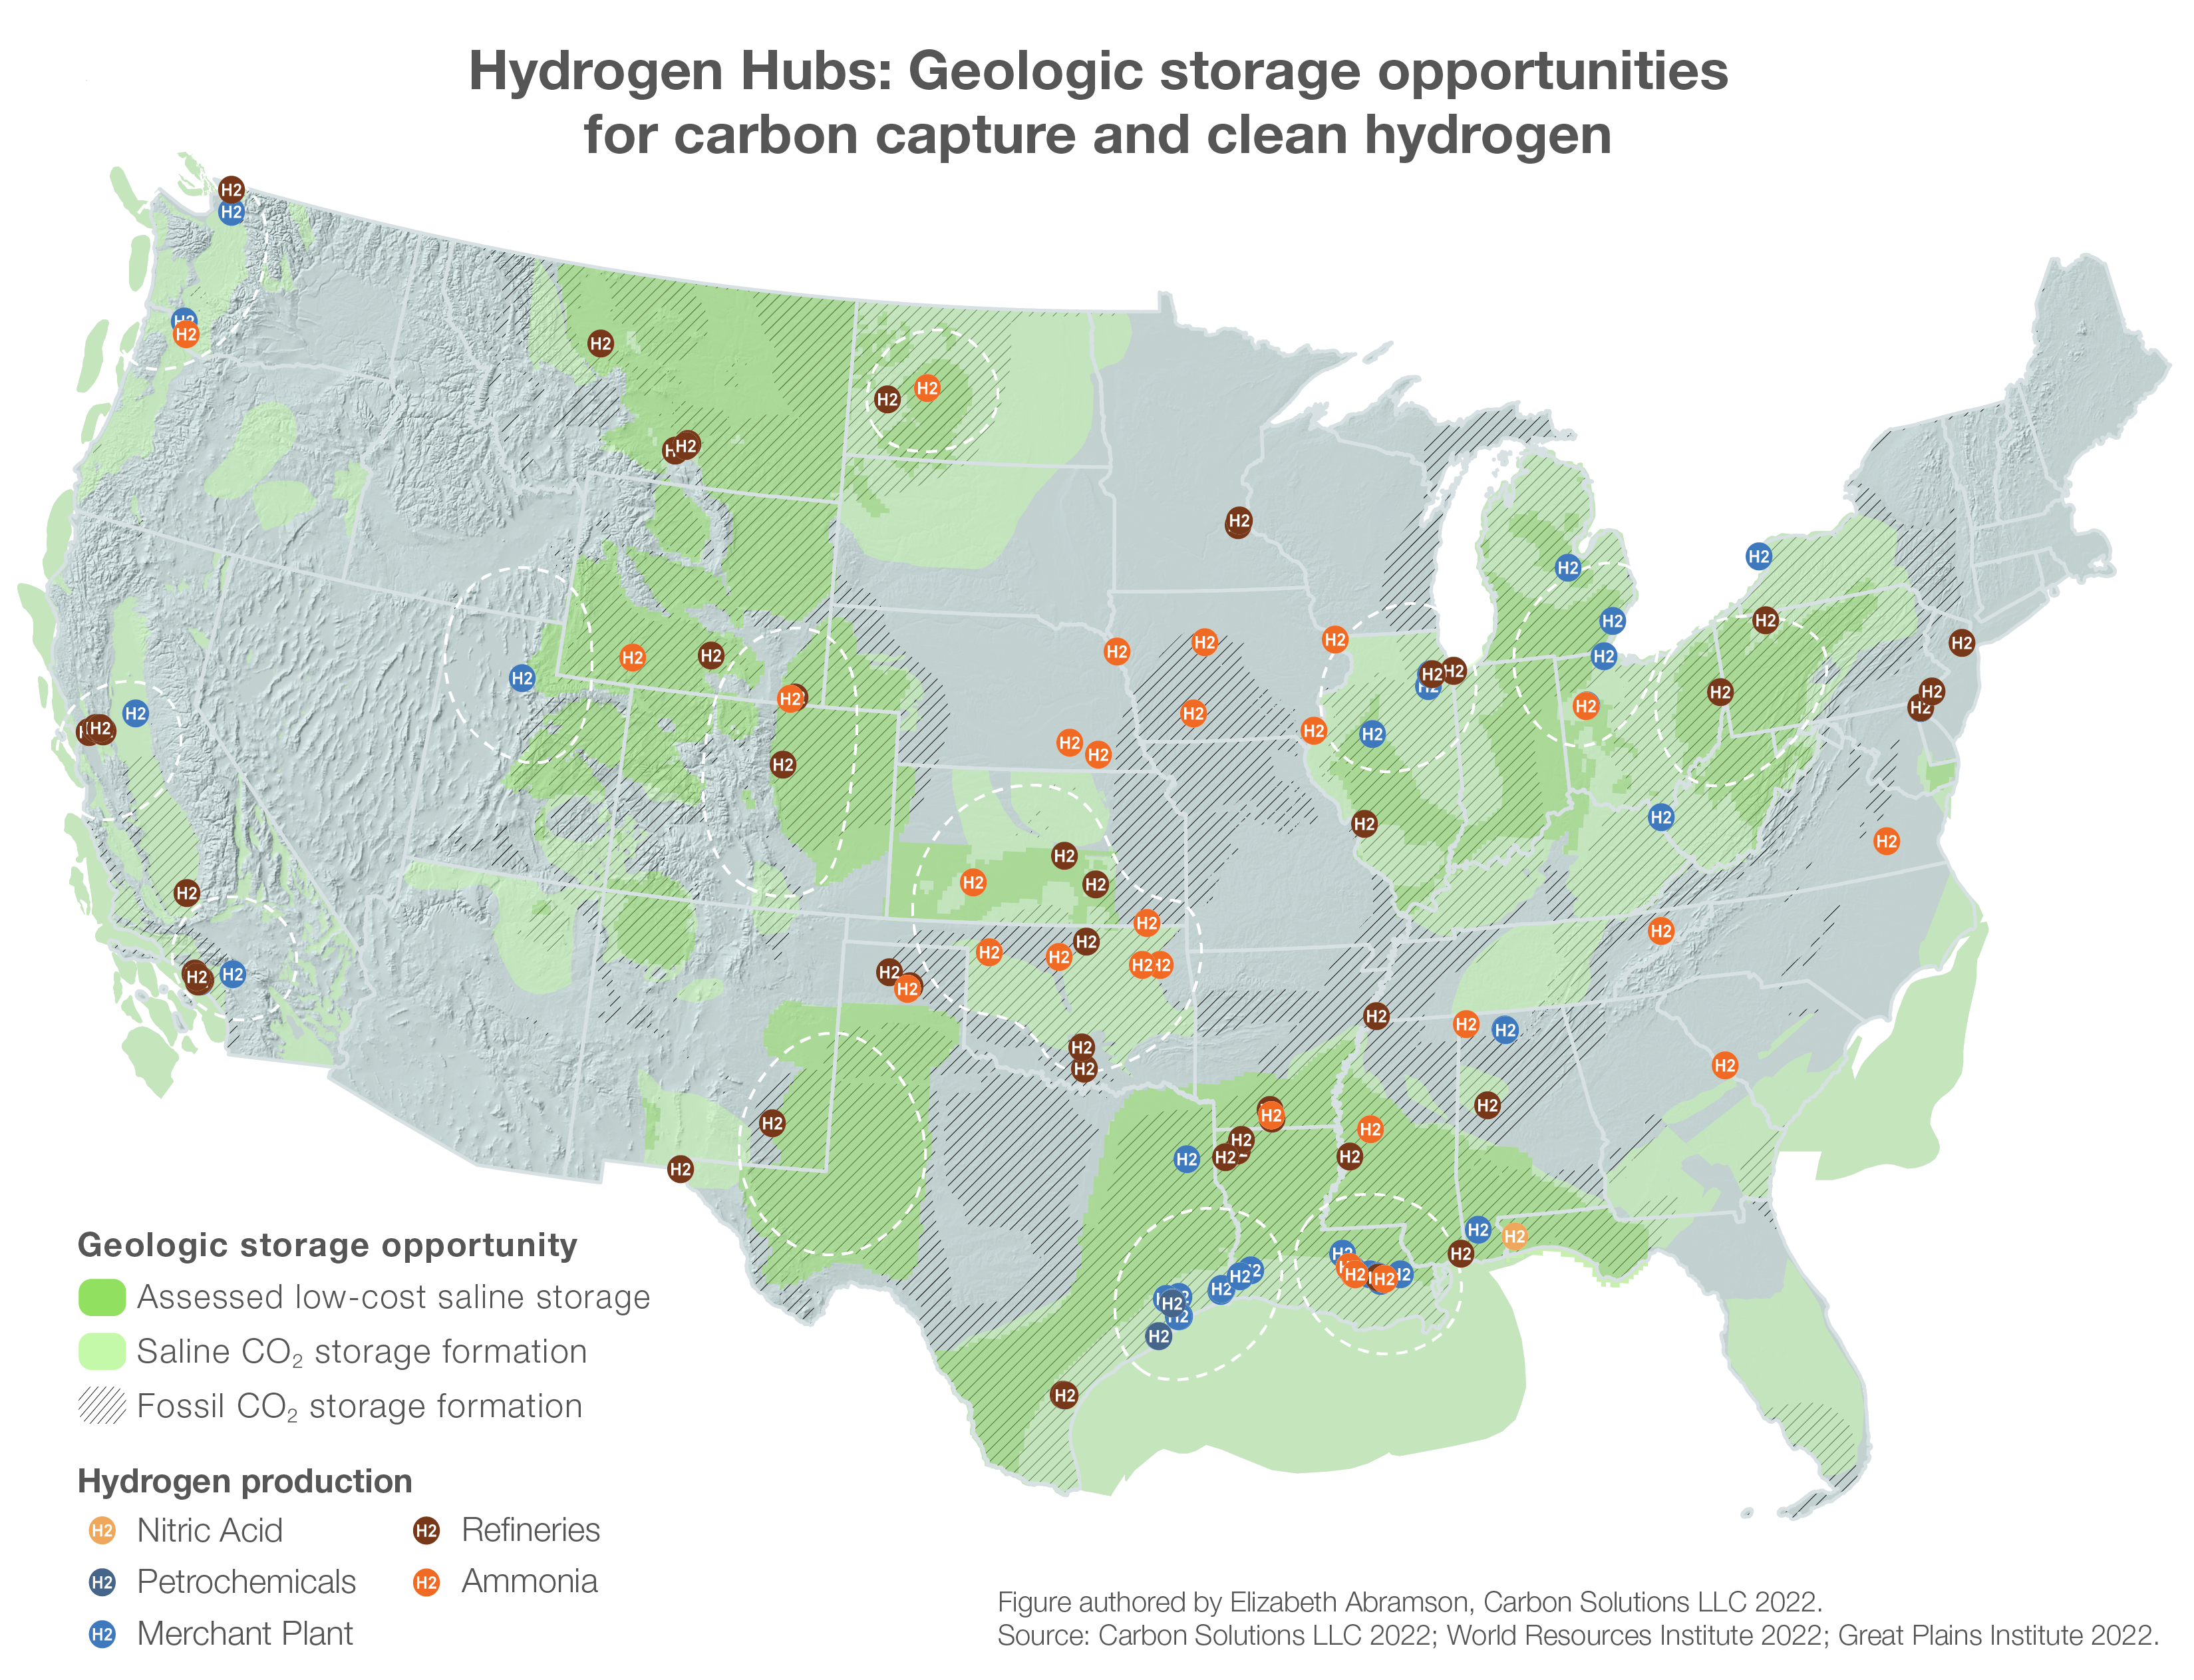
Fossil fuel displacement with hydrogenThe next map highlights areas of opportunity to replace industrial fossil fuels with clean hydrogen, showing existing industrial consumption of fossil fuels along with estimated hydrogen production from existing facilities. Most of the 10 million metric tonnes of hydrogen produced in the US each year is currently made from natural gas-derived methane, a fossil fuel. About 55% of this hydrogen is used in the refining sector, 35% in ammonia and fertilizer applications, and the remainder is used as a chemical feedstock and fuel in a handful of other industries. The recent Clean Hydrogen Production Tax Credit establishes stringent lifecycle GHG intensity standards for hydrogen production. Low GHG-intensity hydrogen can be produced by using zero-carbon electricity for electrolysis, or carbon management with methane feedstocks. The DOE’s Clean Hydrogen Roadmap projects that using clean hydrogen can reduce US emissions approximately 10 percent by 2050 relative to 2005, helping enable achievement of our climate and decarbonization goals. Through initiatives including the H2Hubs program, the clean hydrogen production tax credit, and DOE’s Clean Hydrogen Roadmap, the DOE has identified strategic opportunities for 10 million metric tonnes of clean hydrogen annually by 2030, 20 MMT annually by 2040, and 50 MMT annually by 2050. 
Clean energy for hydrogen electrolysisThe final map in this post charts the projected carbon intensity of the electric grid in 2030 (from NREL ReEDS) and existing or planned zero-carbon electric power plants, to help identify potential hubs for new low-carbon hydrogen production.Whereas most hydrogen produced today through steam methane reforming would require carbon capture to achieve a low carbon intensity, clean hydrogen can also be made through electrolysis, a relatively simple but electricity-intensive process of splitting water (H2O) into oxygen (O2) and hydrogen (H2). If the electricity used to power electrolysis is generated from a zero-carbon resource such as wind, solar, or nuclear power, the resulting hydrogen may qualify for the recent Clean Hydrogen Production Tax Credit. Looking at the map, a new electrolysis project could target areas of the electric grid with a low carbon intensity or engage in a power purchasing agreement for purely renewable or nuclear electricity from a specific low-carbon provider. The DOE’s Clean Hydrogen Strategy and Roadmap aims to achieve gigawatt-scale (GW) national production capacity of hydrogen via electrolysis in the late 2020s. According to DOE data, there are only 7 electrolyzers in existence in the United States with a capacity of 1 megawatt (MW) or above. The largest of these has an electrical capacity of 5 MW (or .005 GW). That means we would need to build about 200 of these plants in the next few years to achieve a gigawatt of capacity. However, the DOE also reports a handful of proposals around the country for electrolyzers with an electrical capacity of up to 120 MW. We would only need to build 10 or so of these to achieve gigawatt-scale electrolysis capacity. If operating at nearly full time, a 1 GW production capacity would yield about 150 thousand metric tons of hydrogen, representing about 1.5% of the current US market of ~10 million metric tons per year. 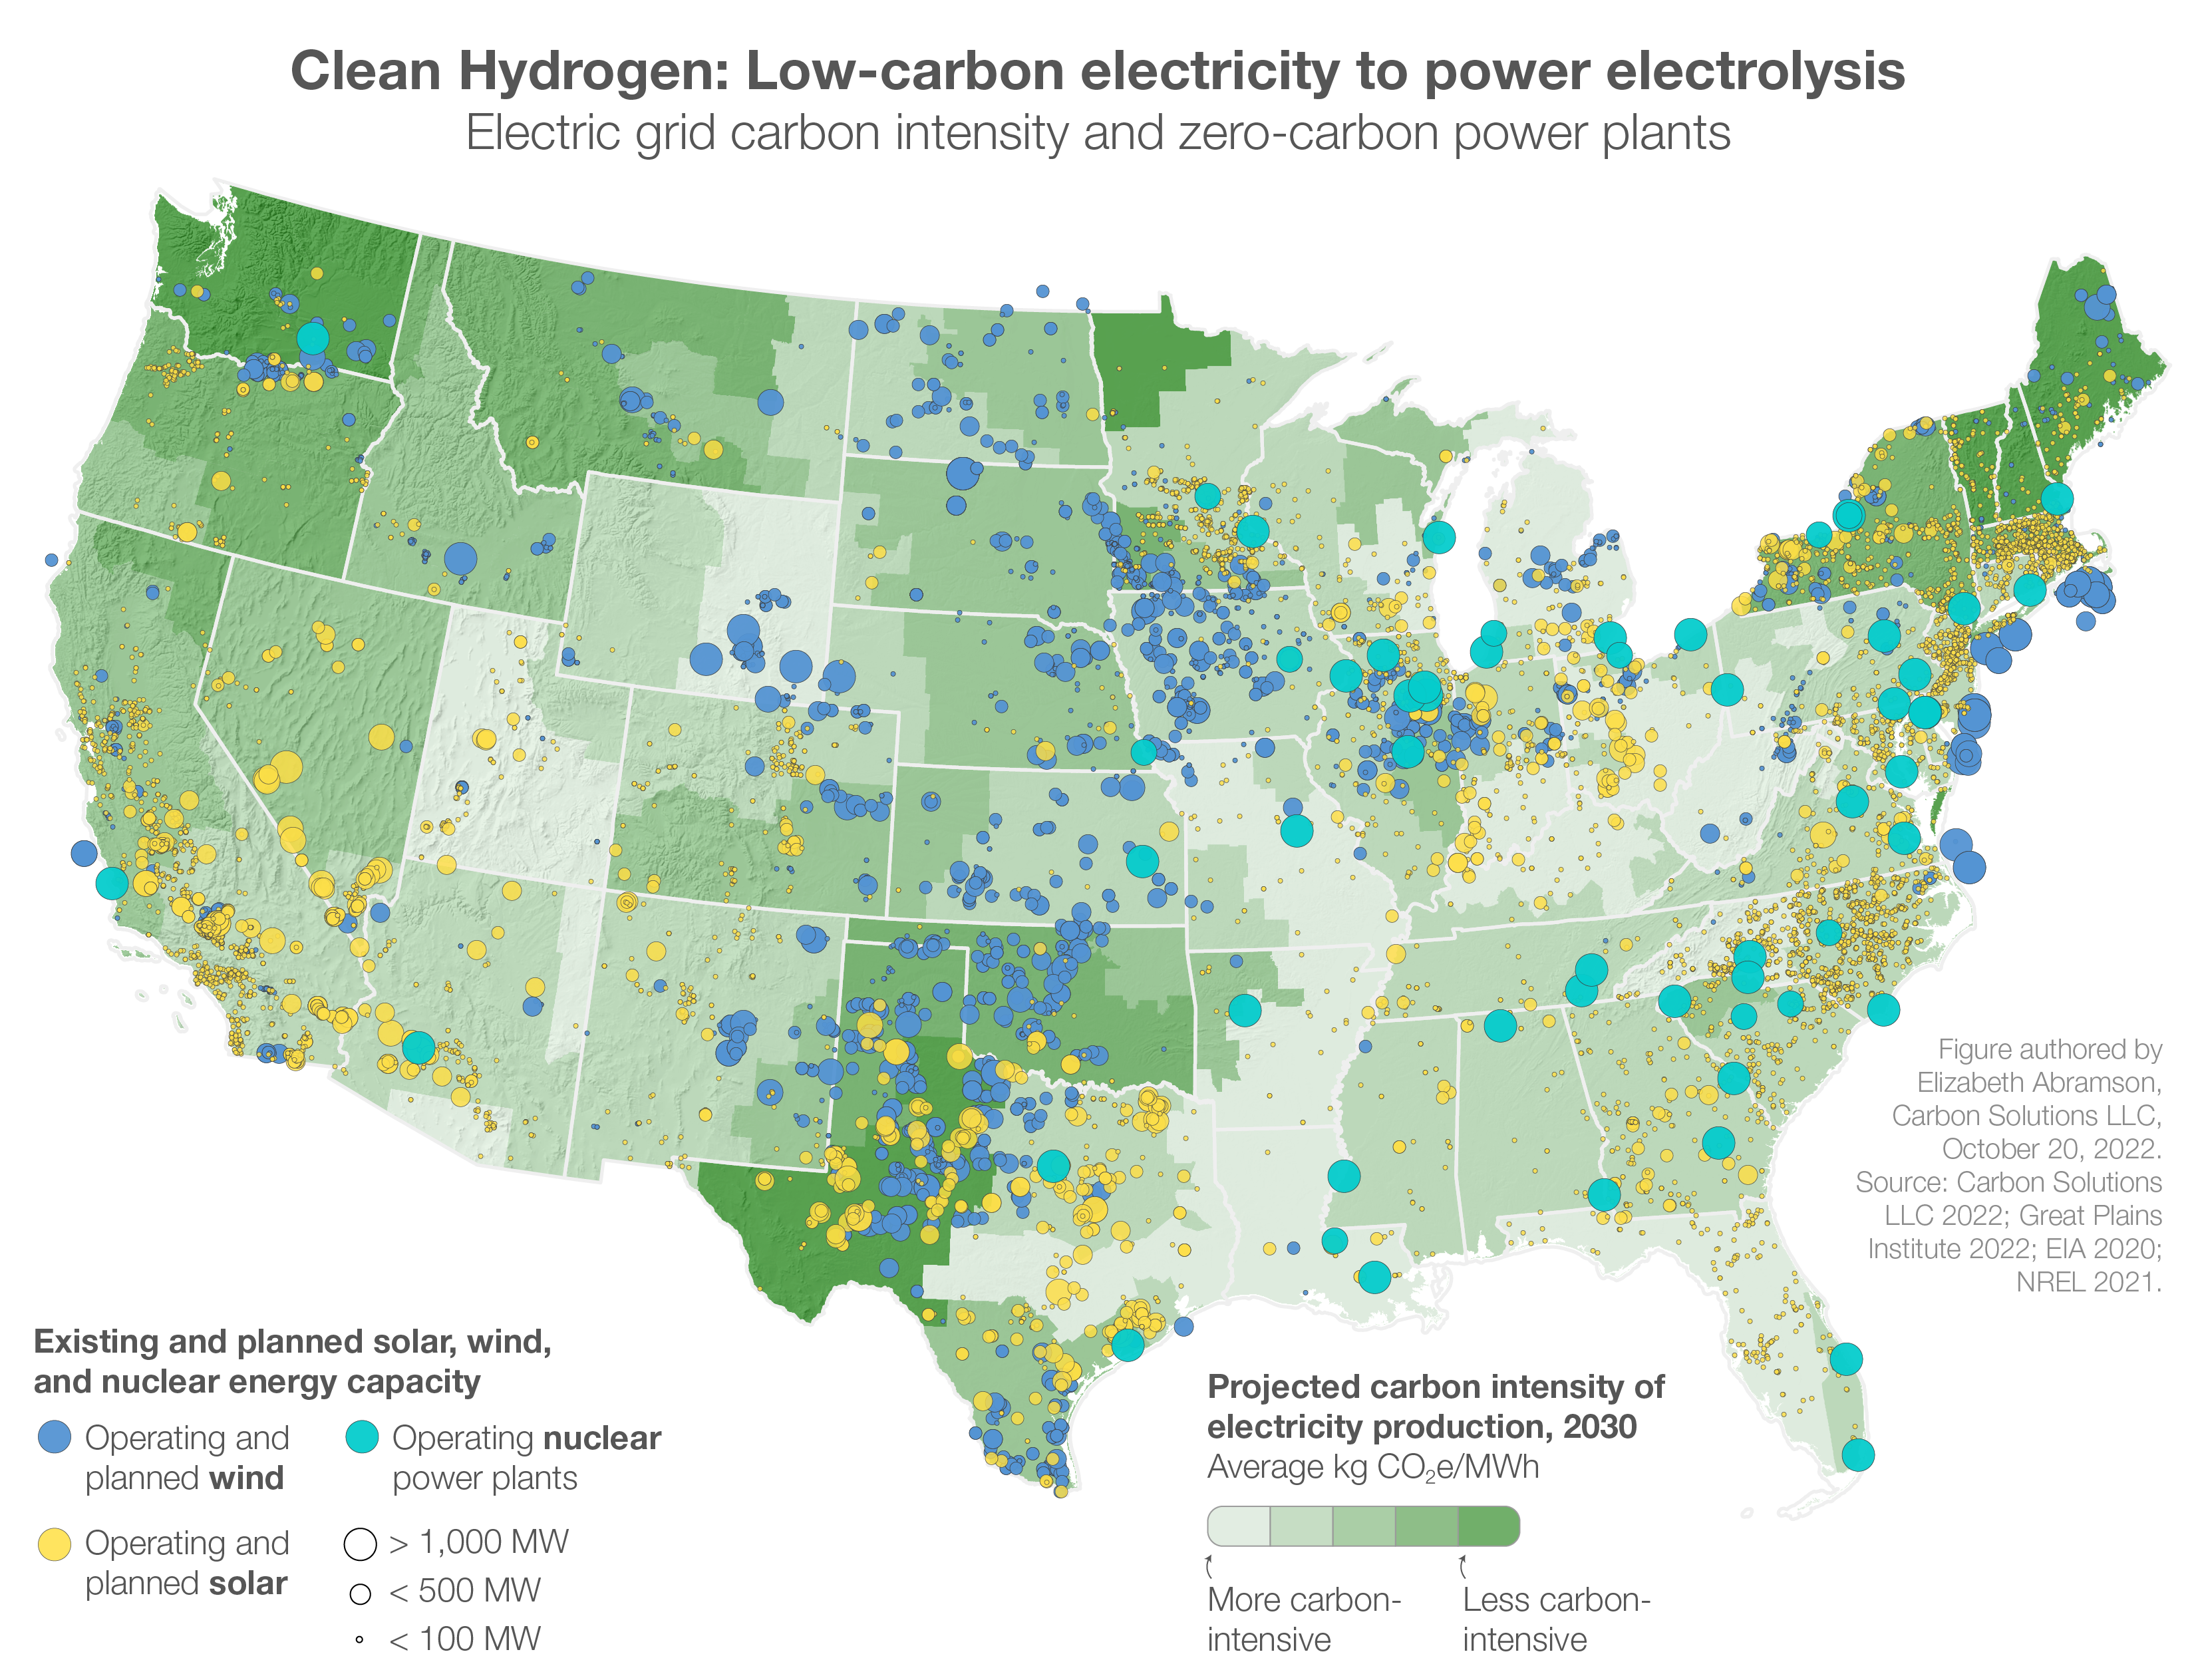 Carbon Solutions is embarking on a number of initiatives to support the development of hydrogen hubs throughout the United States. If you are interested in learning more, feel free to get in touch with me at dane.mcfarlane@carbonsolutionsllc.com ContributorsGIS Analysis, Design, and Writing Analysis, Writing, and Editing AcknowledgementsThank you to Zachary Byrum and John Feldmann, WRI, for advisement and analytical contributions that made these maps possible. |