About the National Industrial Sector Decarbonization Report
The report evaluates the potential for carbon capture and storage (CCS) across U.S. industrial sectors using a suite of integrated modeling tools. It aims to identify cost-effective, scalable CCS deployment strategies to support CO₂ emissions reduction in hard-to-decarbonize sectors.
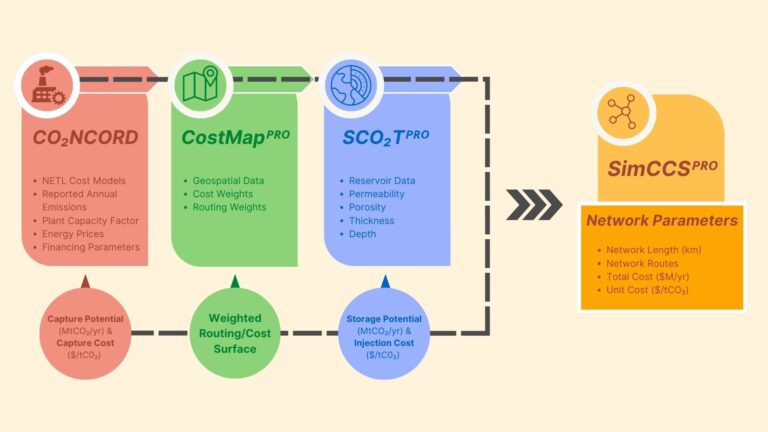
The study uses four core tools:
- CO₂NCORD: Estimates capturable emissions and capture costs by facility and sector.
- SCO₂Tᴾᴿᴼ: Models geologic CO₂ storage capacity and cost using site-specific reservoir data.
- CostMAPᴾᴿᴼ: Calculates pipeline routing and infrastructure costs using geospatial data layers.
- SimCCSᴾᴿᴼ: Optimizes CCS networks using cost and emissions data, creating realistic, least cost pipelines.
Where are the capture opportunities from this study?
The facilities used in this study were selected due to their relatively high CO₂ emissions at each facility, low cost of capture, and/or importance for regional emissions reductions.
The map below shows the sectors, facilities, emissions ranges and capture cost ranges of emissions sources considered in this study. Some things to note:
- Capture costs vary widely by sector. Ammonia and ethanol are the least expensive per ton of CO₂ captured, and iron & steel, cement, and hydrogen were amongst the most expensive.
- Refineries have the highest capturable emissions per year, followed by pulp & paper, ethanol, cement, and petrochemicals.
- Facilities emitting less than the 45Q threshold were excluded.
Where are storage opportunities?
SCO2TPRO provides screening estimates for CO2 injection rates, plume size, storage potential, and per tonne costs. Some additional information about storage sites for this study is:
- >1000 possible storage locations.
- Storage costs range from <$6/tCO 2 to >$30/tCO₂ depending on site characteristics.
- Only onshore saline aquifers were considered; offshore and EOR sites were excluded from this study.
Where can CO₂ pipelines be routed?
CostMAPᴾᴿᴼ is a geospatial modeling tool used estimate costs of routing CO₂ pipeline infrastructure. Routing and cost surfaces are decoupled to ensure a realistic pipeline network that balances economic, environmental, and social factors. The routing surface determines feasible network paths, and the cost surface estimates the financial cost of building pipelines. In this project, the data used for constructing these surfaces are:
- Existing pipelines, railroads, roads, and transmission lines
- Land cover
- Slope
- Population density
- Federal and state land
Given all possible sources, or emitting facilities, sinks, or storage locations, and the routing surface, a candidate network is constructed. This candidate network is the universe of possible pipeline networks that could connect any to any sink.
How might CCS decarbonize industrial emissions?
To understand how CCS infrastructure might develop, SimCCSᴾᴿᴼ was run to model the impact of increasing the amount of CO₂ that is captured on cost, network length, and pipeline diameter. Each scenario on the map below shows the unique combination of captured emissions sources, storage sinks, and pipelines that are necessary to capture the selected amount of CO₂.
- The total emissions for all facilities is 618 MtCO₂/yr; results are shown in 100 Mt increments, from 100 MtCO₂/yr to 618 MtCO₂/yr.
- At the 100MtCO₂/yr target, 300 unique CO₂ sources are captured, and at 618 MtCO₂/yr, CO₂ from 1874 sources is captured.
- The pipeline network required to capture emissions at 100MtCO₂/yr is just over 6500 km. To capture CO₂ from all industrial facilities in this study, almost 55,000 km of pipelines are required.